Satellite Imagery Analysis: Kerala Flood
Did the super-cool images of earth that NASA publishes now & then ever intrigue you? Did ever want to play around or explore them? It did to me atleast! These processed Earth Observation (EO) data that are available in abundance on the internet for free-usage and research.
Last week NASA released an image of this area with false-colours to mark the flood affected regions of Kerala. So having had some experience with analysing earth-observation data from European Space Agency before, I decided to look at the satellite images myself for this month. The last time (and probably the only time) I wrote a tech blog was SAP Earth Observation Analysis Microservices on YaaS 2-yrs ago. As I mentioned last week in My Imagery Story with Science and Art, I would try to be more regular with tech-blogs and not just photo-blogs.
In this post I am going to discuss how we can start extracting meaningful informations from satellite images with the recently occurred Kerala Flood in India as the application.
Donation for the Disaster: Before starting, I would like to request you to donate whatever amount you wish to for the relief-fund. This natural disaster hit this Indian state really bad with 300+ killed and a million people having to evacuate within a fortnight in August 2018. I myself have used the following portals: NGOs via Amazon.in and DonateKart.
What is EO data and why is it important?
EO data are satellite imageries of the earth with objective coverage across both space and time. They are extremely powerful scientific tool for analysing various aspects of the earth. Proper analysis of EO data help us monitor, assess, and manage the environment in a better way for improving everyday lives and sustainability
Nowadays, global climate change is one of the major concern with advancing technologies and growing human intervention in the natural environment. Increasing heat waves, shrinking of glaciers, rise in sea level, change in forest cover, change in precipitation patterns have innumerable negative impact on every life on the earth. There are a lot of experts who are currently trying to improve the situation by monitoring and assessing the extraordinarily complex system of our planet. EO data is the most important source for this task. In most cases the EO data-sets are scientifically too complicated, and extremely large in volume to be processed and stored.
What is the data-set will we talk about?
For the Kerela Flood application, We are going to use the images generated from the Copernicus program by European Space Agency (ESA). The program has a total of 6 Sentinel missions where each mission always involves two satellites to assure revisit and coverage requirements for providing robust data-set.
What kind of satellite generate these data?
Remote sensing technologies such as radar and multi-spectral imaging are used by the satellites depending on the data-set it aims to produce for a given service. In our case we use multi-spectral images generated by Sentinel-2A satellite. This particular satellite has a systematic coverage of land and coastal areas between 84◦N to 56◦S with a revisit time of . It has a revisit time of 10-12 days. The swath width of the area sensed on the earth’s surface by this satellite is about 290km.
What exactly one single image represent?
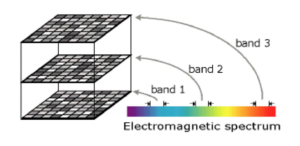
Each granule of image has multi-spectral collection of 13 spectral bands or associated images with wavelengths ranging from 443nm − 2190nm. The principle behind the optical instrument of the Sentinel-2 satellite lies in the fact that the earth absorbs some amount of solar energy it receives and reflects the rest. It is this reflected energy across various wavelengths that allows the multi-spectral instrument to have different number of bands for a single imagery.
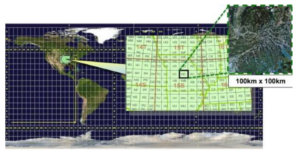
Each granule of image covers about 100km × 100km on the earths surface with spatial resolutions of 10m, 20m, and 60m per-pixel depending on the spectral band. They are available as JPEG2000 lossless compressed images along with associated meta-data such as time-stamp, dimensionality, and reference coordinate spatially registered on UTM projection and WGS84 ellipsoid. More can be found at the Sentinel-2 handbook.
How to deal with cloud masks?
Every granule contains a lot of metadata associated. It includes the land/water masks and the cloud masks as easy to use Geographic Markup Language (GML) files. It is important to note that the data produced by Sentinel-2 is affected by cloud-blockage, unlike Sentinel-1 which is independent of cloud-blockage due to its Synthetic Aperture Radar (SAR) principle. We will limit the scope of this blog to only multi-spectral imagery from Sentinel-2.
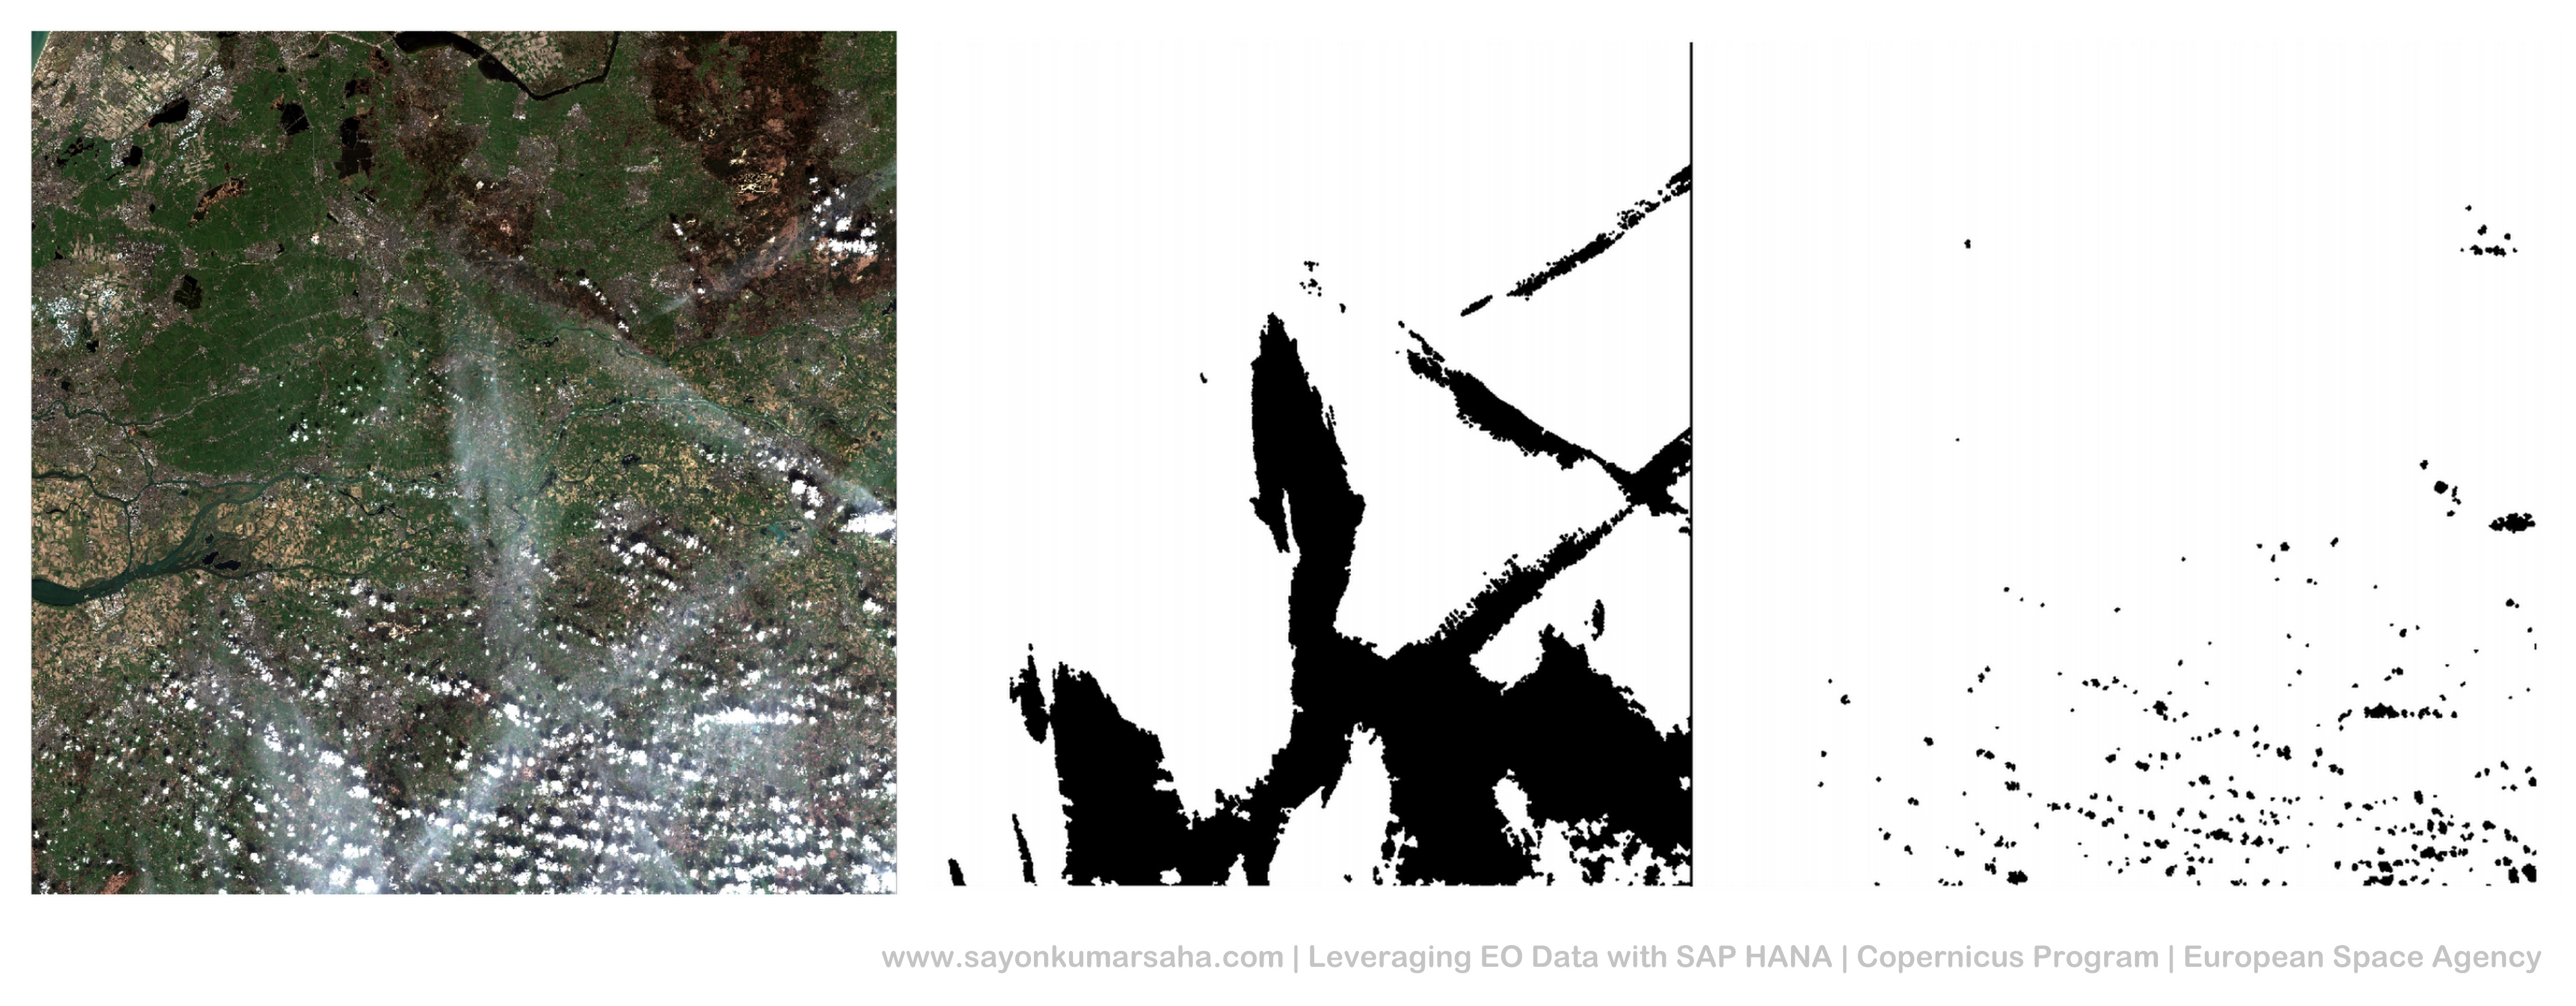
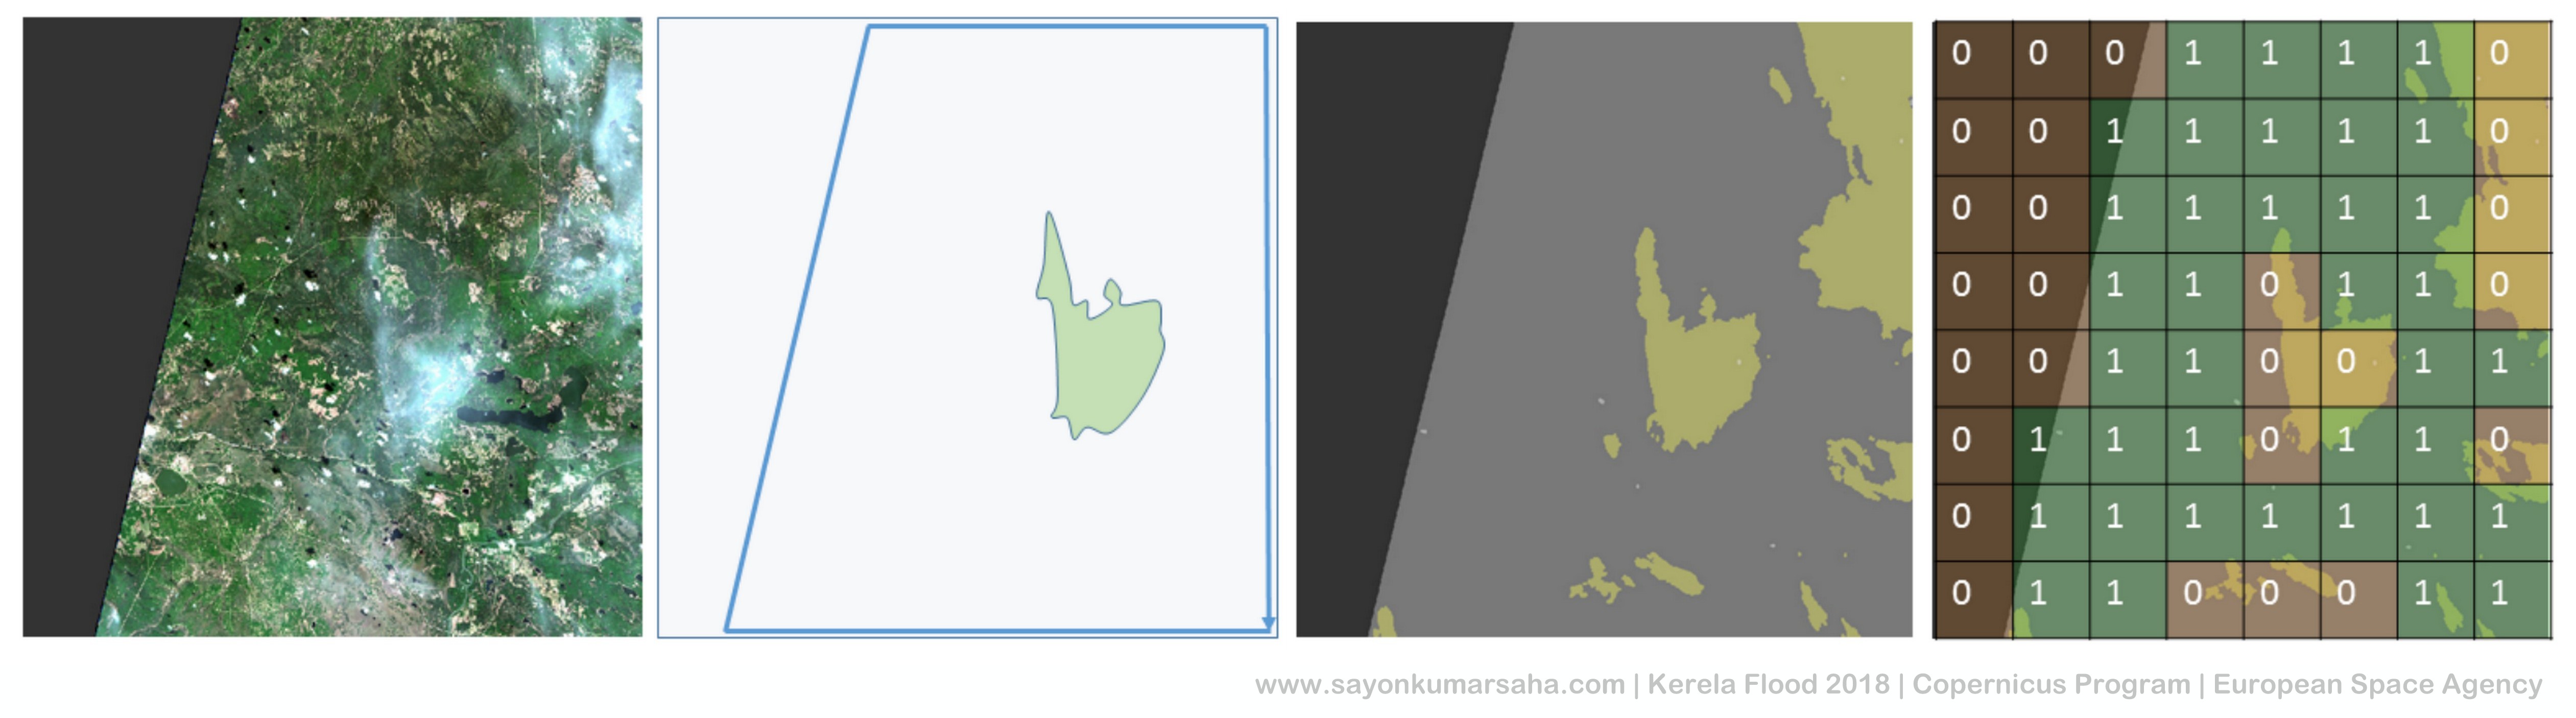
Some illustrations of handling cloud masks are as follows:
Downloading open-source Sentinel-2 products?
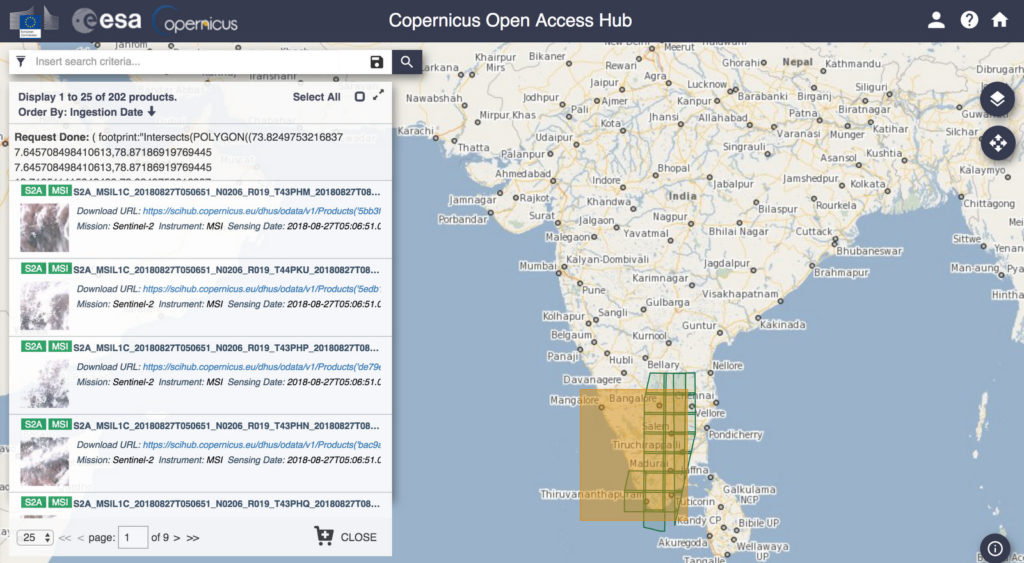
The data is raw and partially-processed open-source and available for download at the Copernicus Open Access Hub. One mandatorily needs an account to be created for downloading data so that usage can be monitored for security reasons. If you are not using a script to download, APIs are also available where filters can be attached for automated and regular download of imagery. If you are scanning the product manually, it is possible to draw bounding boxes on the map to choose products, zoom in and check the meta-data details before downloading it. A screenshot later in the blog illustrates donwloading Sentinel-2A data from the Copernicus Open Access Hub with bounding-box in Southern India
How do you read such heavy images and associated metadata?
There are two ways: Either you can use Python alongwith the OpenCV and GDAL library. Or you can use the tool SNAP.
If you are using Python, I have some examples in this repository called satellite-index-earth-observation-experiement. The geoparsing module can be adapted for reading a granule and using it as a Numpy vector. It can be visualised as per the requirement using the geovisualizing module.
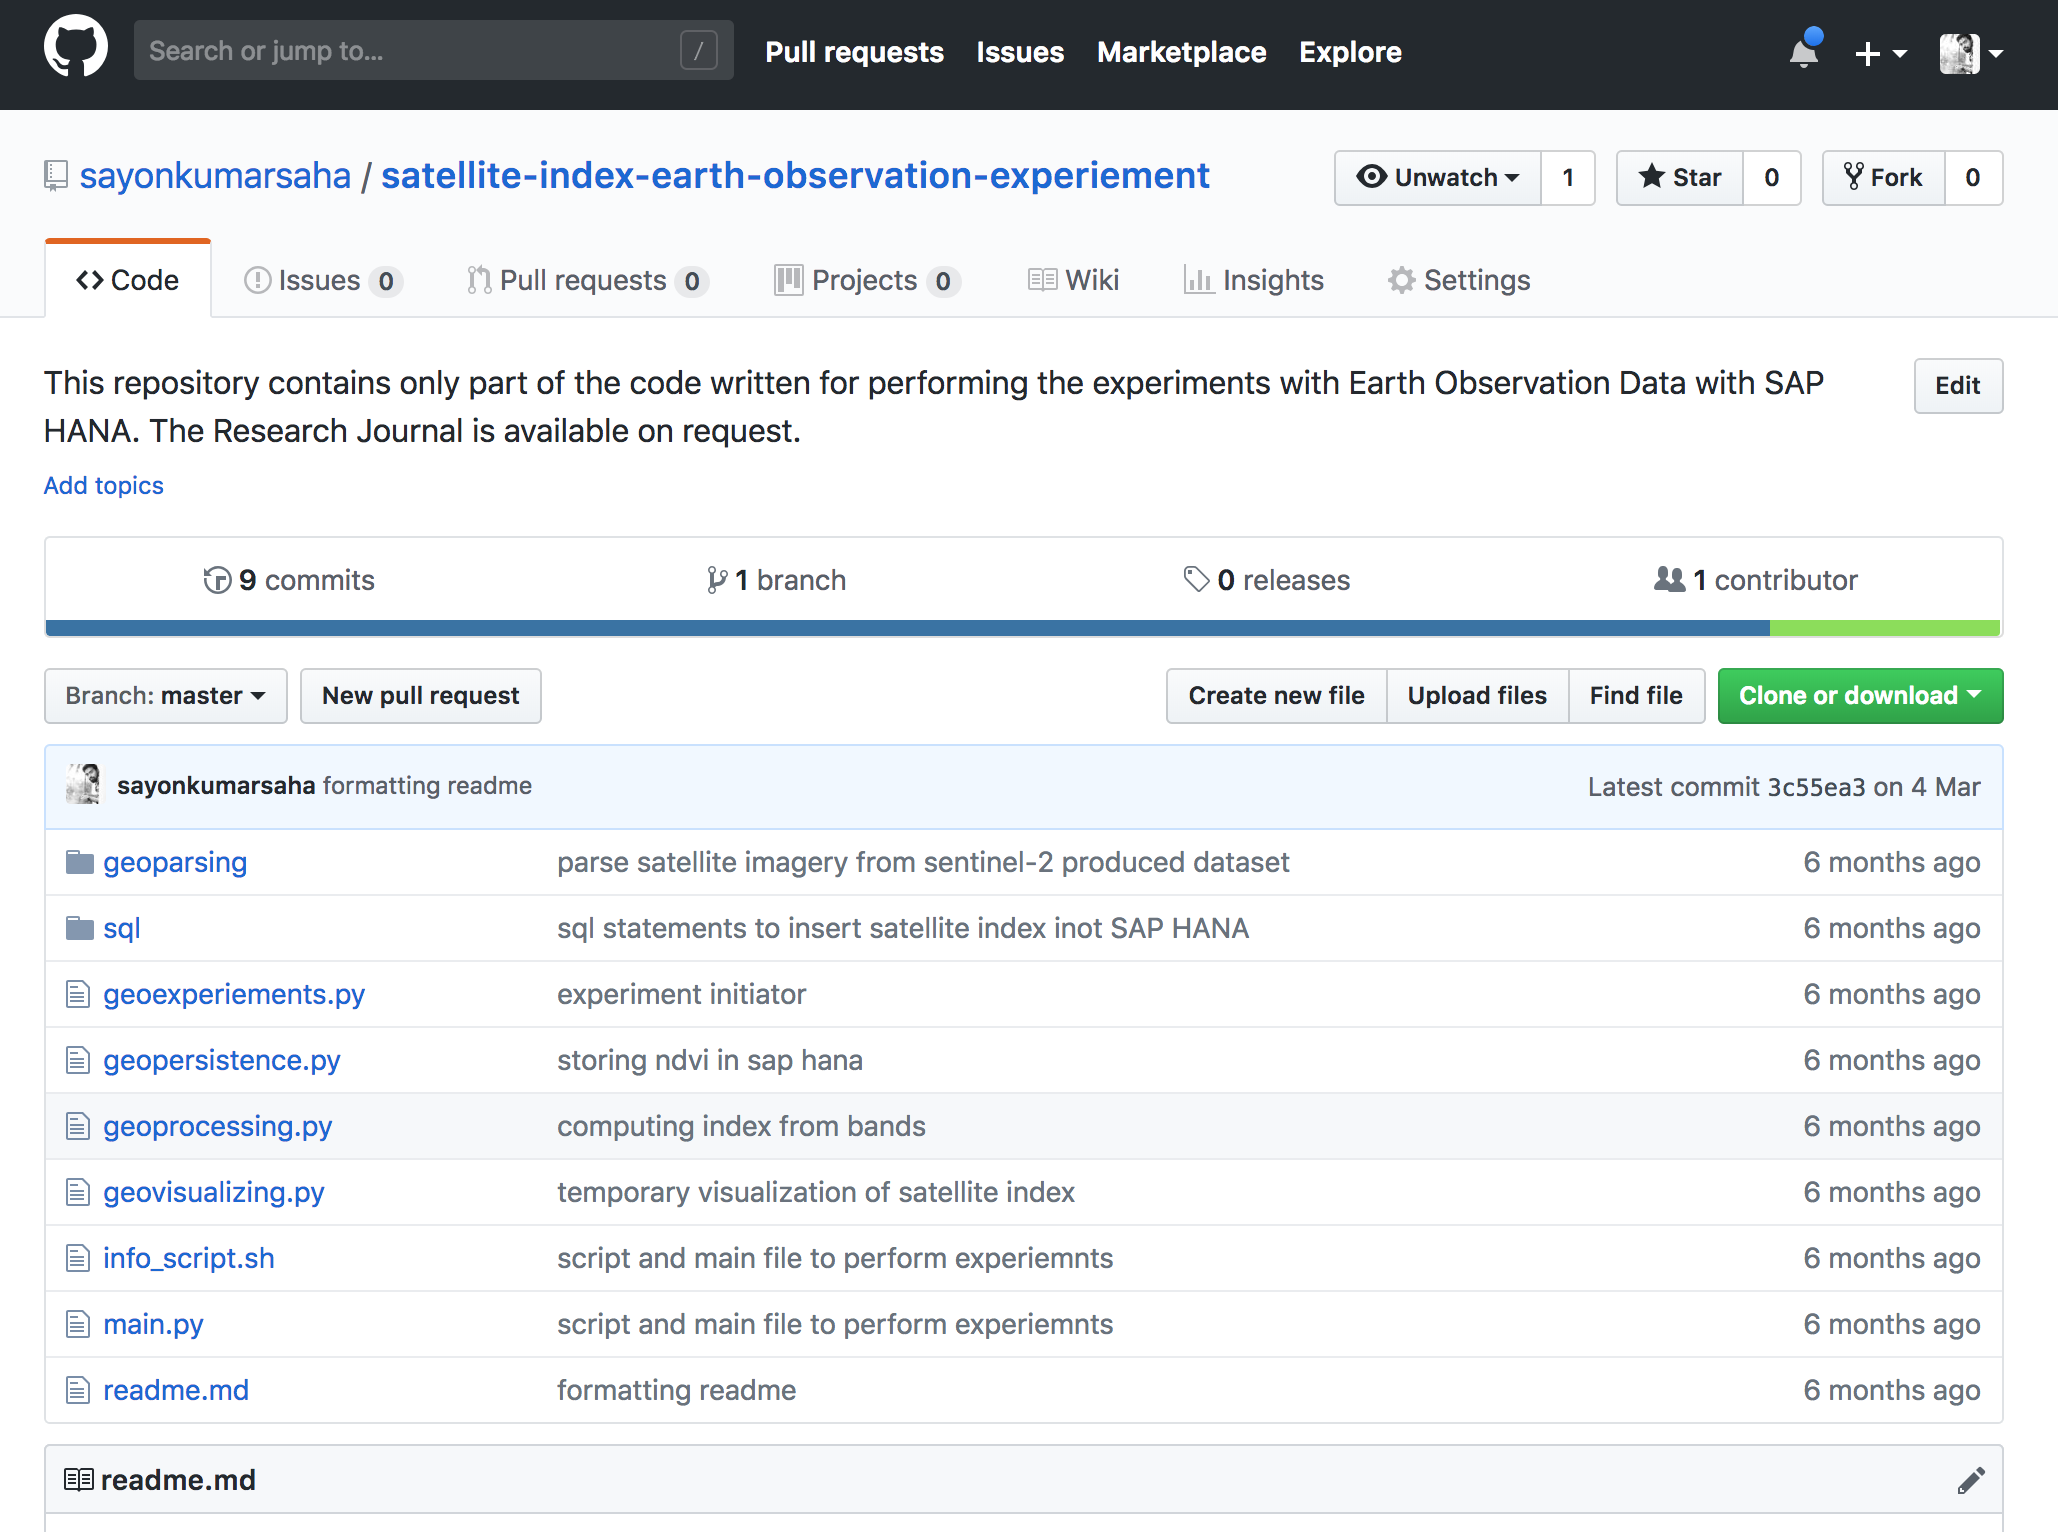
Please note that the code in this repository was used for a different purpose in the past, thus not ready to be used or extended. It has to be adapted accordingly. Although the commits might be 6 months ago, but it was used in winter 2016 and adapted for the Sentinel products back then.
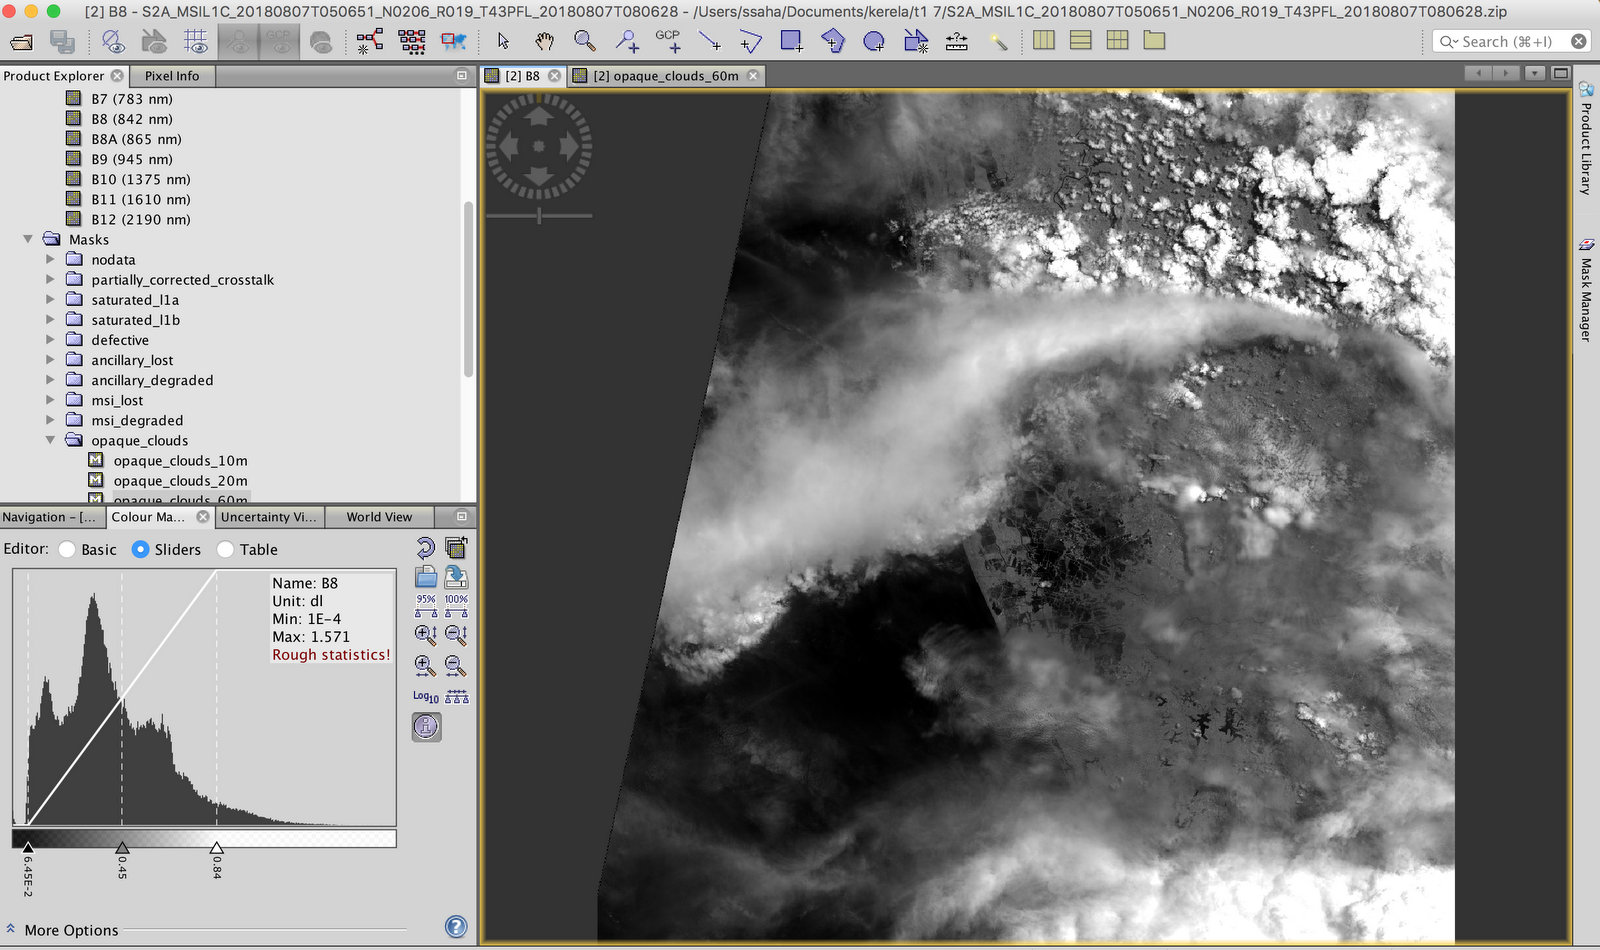
If you want to use the tool instead of writing code, the Sentinel Tool box called SNAP can be downloaded here. You can easily import the zip files directly into the toolbox and explore the various possibilities. All the relevant metadata associated with the granule can also be explored using this powerful tool. It is under constant update to integrate more and more raster processing facilities using Sentinel satellite images.
Kerala Flood?

The south Indian state of Kerala faces the worst flooding of that area in nearly a century in August 2018. Unusually high rainfall during the monsoon season and large discharge from dams caused the death of around 500 people. Atleast a million had to be evacuated.
Fetching relevant Satellite Data?
As discussed earlier, I looked for available Sentinel-2 product sensed in this region during this time at the Copernicus Open Access Hub. I noticed we had products in this region sensed on 07.08.2018, 17.08.2018, and 27.08.2018. In total there were 2 granules that seemed interesting for that flooded region.
As expected expected during flooding, most part of the granules were covered with thick clouds, especially on 17.08.2018. For this blog post, I would not go into extracting the cloud masks for validating pixels since we are not embedding this information spatially on a real map.
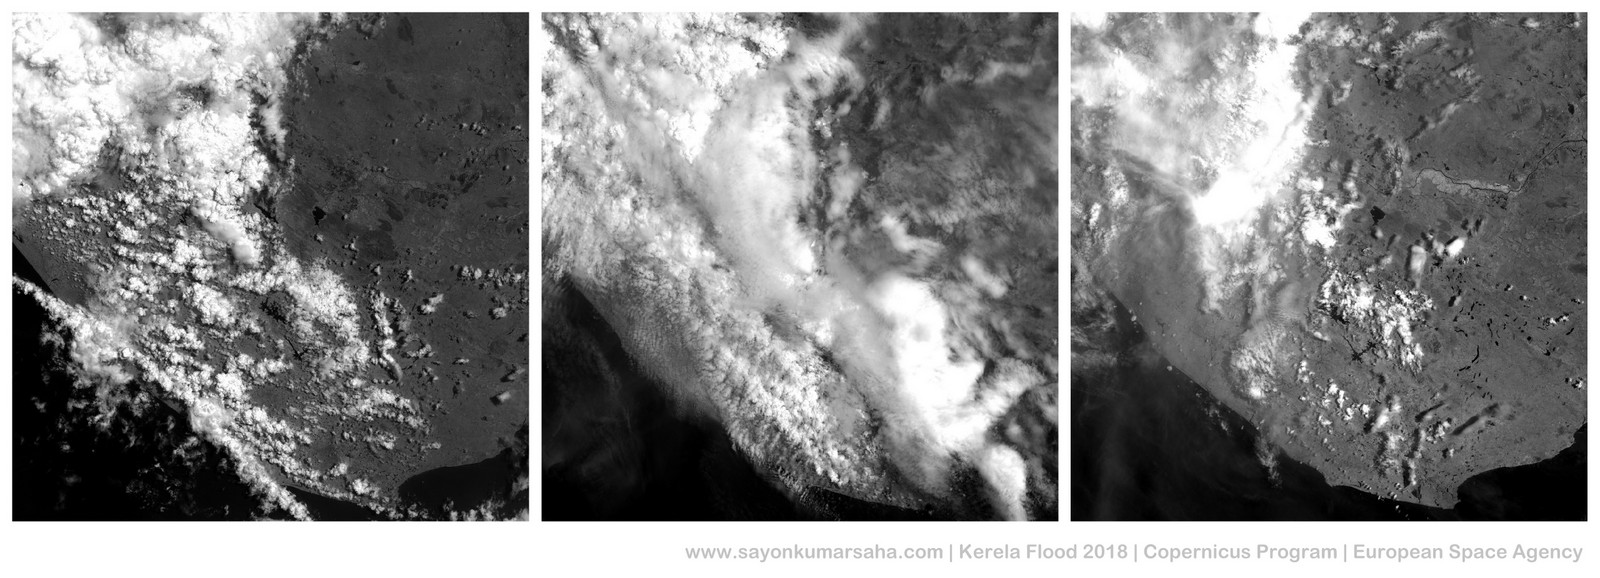
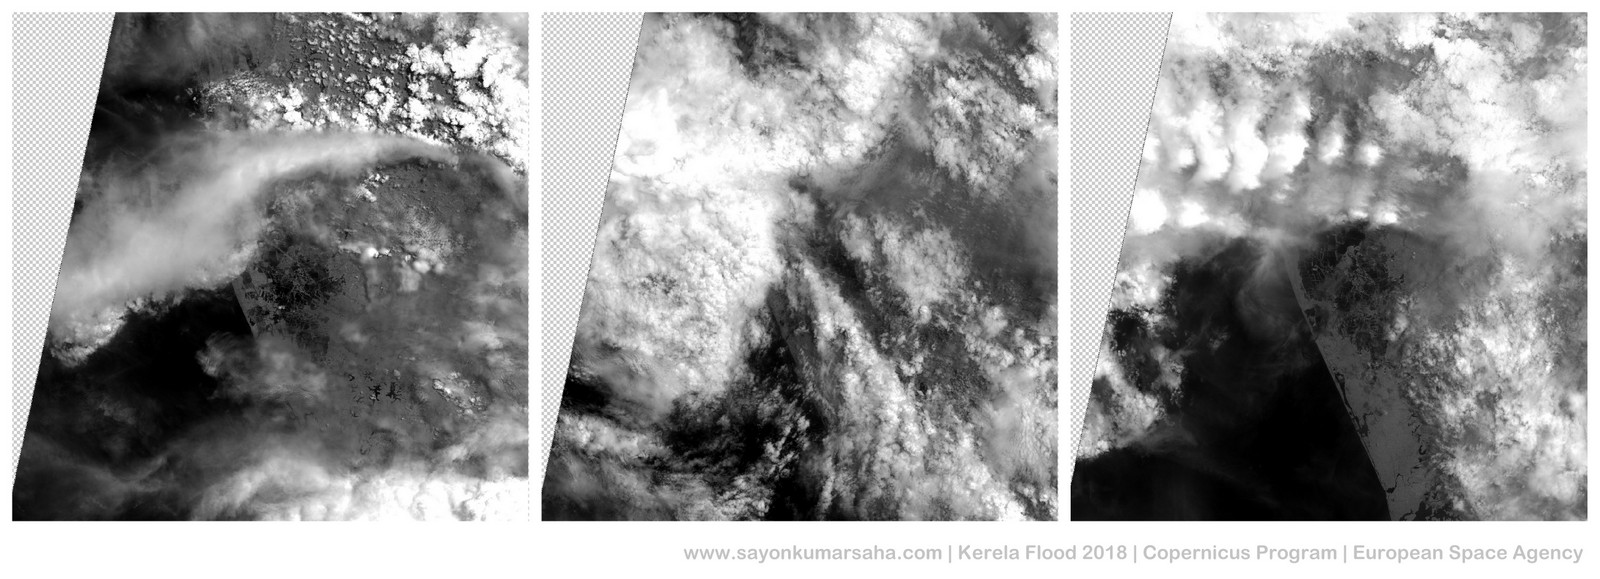
All the granules coming up next that I have rendered are 100km x 100km on the earths surface where every pixel of the image covers roughly an area of 10km x 10km (area coverage of 10,000 km2 with 120,560,400 pixels (for 10m resolution)). Below are the grayscale renders of one of the bands of the granules I used for Kerala Flood analysis. Each strip of 3 images represent the same region of the earth before the flood, during the flood and after the flood.
Extracting Information: Satellite Indices?
There are innumerable algorithms to extract information out of multi-spectral imagery. The focus of this blog would be specifically Normalized Satellite Indices (NSI). It is a fairly simple algorithm that basically uses normalized difference between reflectance value of different wavelengths from multi-spectral imageries to produce useful information. When sunlight strikes an object, certain wavelengths of the spectrum are absorbed and other wavelengths are reflected. The difference in object reflectance is used to determine their spatial distribution in satellite imagery. These enhancement technique include a raster pixel from one spectral band being divided by the corresponding value in another band.
Some of the common NSIs are:
- Normalized Difference Water Index (NDWI)
- Normalized Difference Soil Index (NDSI)
- Normalized Difference Snow Index (NDSnI)
- Normalized Difference Vegetation Index (NDVI)
All the indices above share this same functional form; the choice of bands used is what makes them appropriate for a specific purpose.These indices are already used by different communities to extract domain-specific information from the imageries generated by the Landsat program of NASA. The recent Copernicus program of ESA generates higher resolution of satellite imageries, thus has a lot of advanced applications.
For this particular application of Kerala Flood, we are interesting in knowing more about the water content of a given area before and after the flood. For this we use Normalized Difference Water Index (NDWI). It is an is the NSI that can be used to measure water content from a satellite imagery. If we are looking for change in water level (e.g. flooding in our case), then we use the green and NIR spectral bands because these have the best information about waterbodies based on the absorption and reflectance properties of vegetation canopy and water surfaces.
NDWI = (Band-03 − Band-08) / (Band-03 + Band-08)
where Band-03 is the Green wavelength range (560nm),
and Band-08 is the  Near-infrared (NIR) range (842nm).
The resultant value of NDWI from the above formulae lies between -1 and +1.
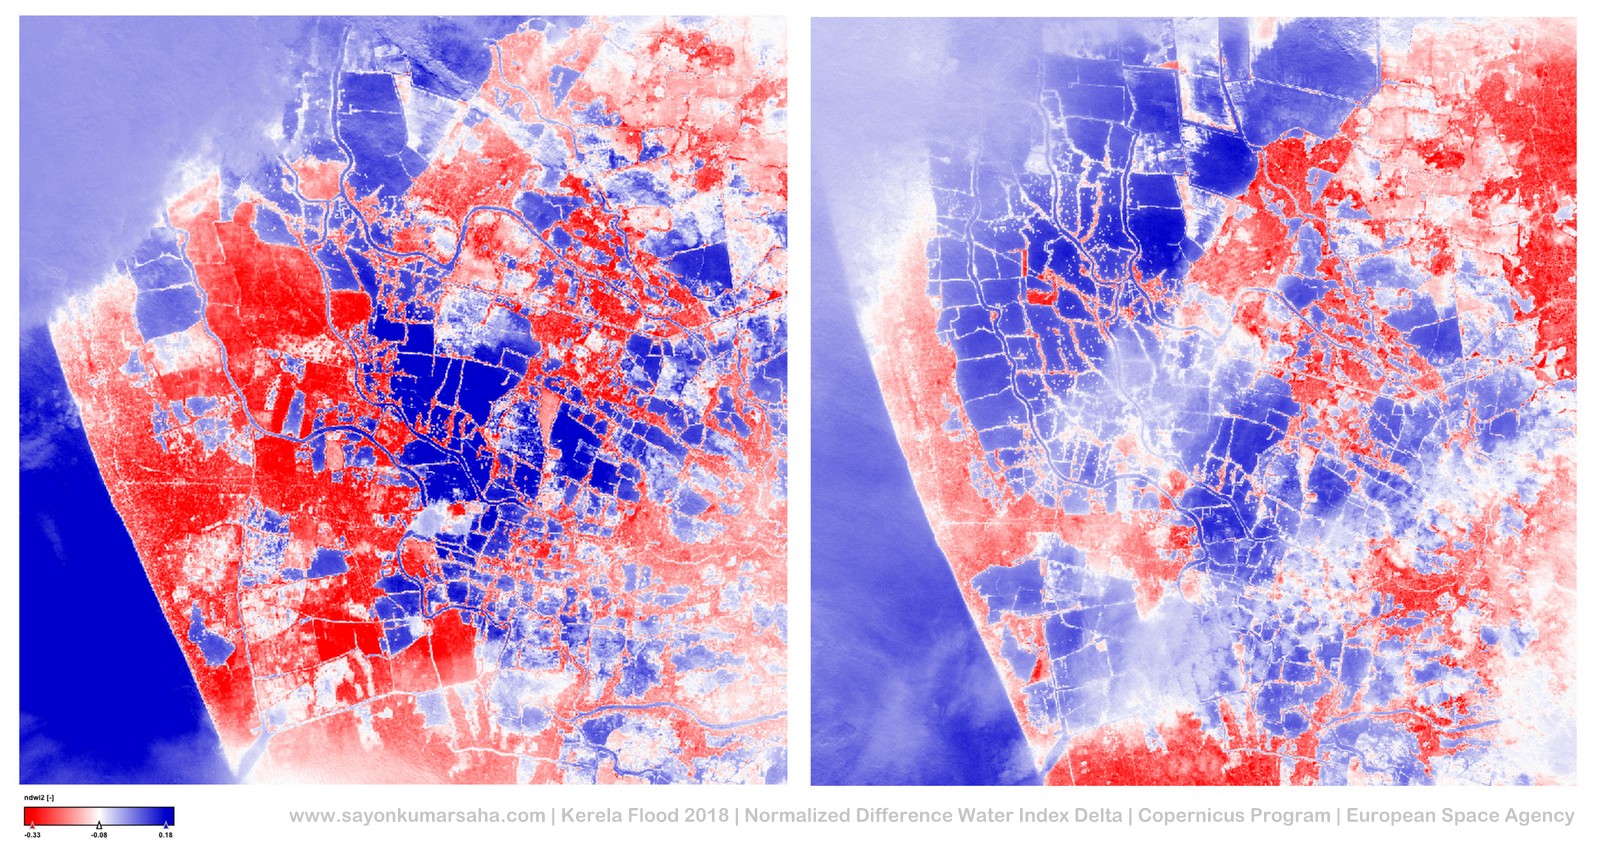
I computed the NDWI using the above formulae for every pixel of the granules illustrated earlier in grayscale. Each granule had 10980 x 10980 pixels which cover a total area of 100 x 100 km on the earth’s surface. I colour coded it and resultant looks like the following.
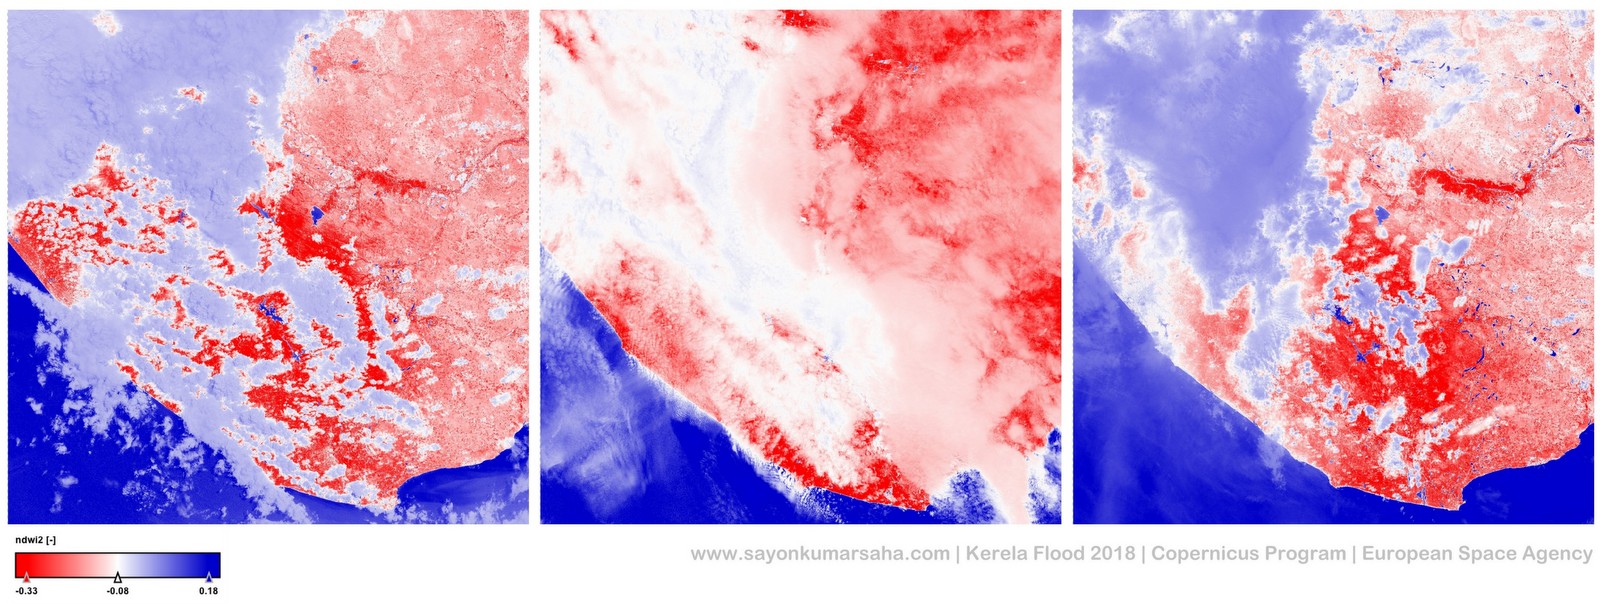
In the above image, the NDWI values of -1 to 0 (transition of red to white) represent bright surface with no vegetation or water content. And the values close to +1 (transition of white to blue) represent water content. Since I did not take into consideration the cloud masks, all the areas covered with white (values around 0) have invalid NDWI values.
In the above image we don’t find any distinctive change in water level in the three (left: 7th Aug, middle: 17th Aug, right: 27th Aug) granules.Also as expected, the granule in the middle is covered almost entirely with cloud because it was sensed during the time of flood caused by excessive monsoon rainfall.
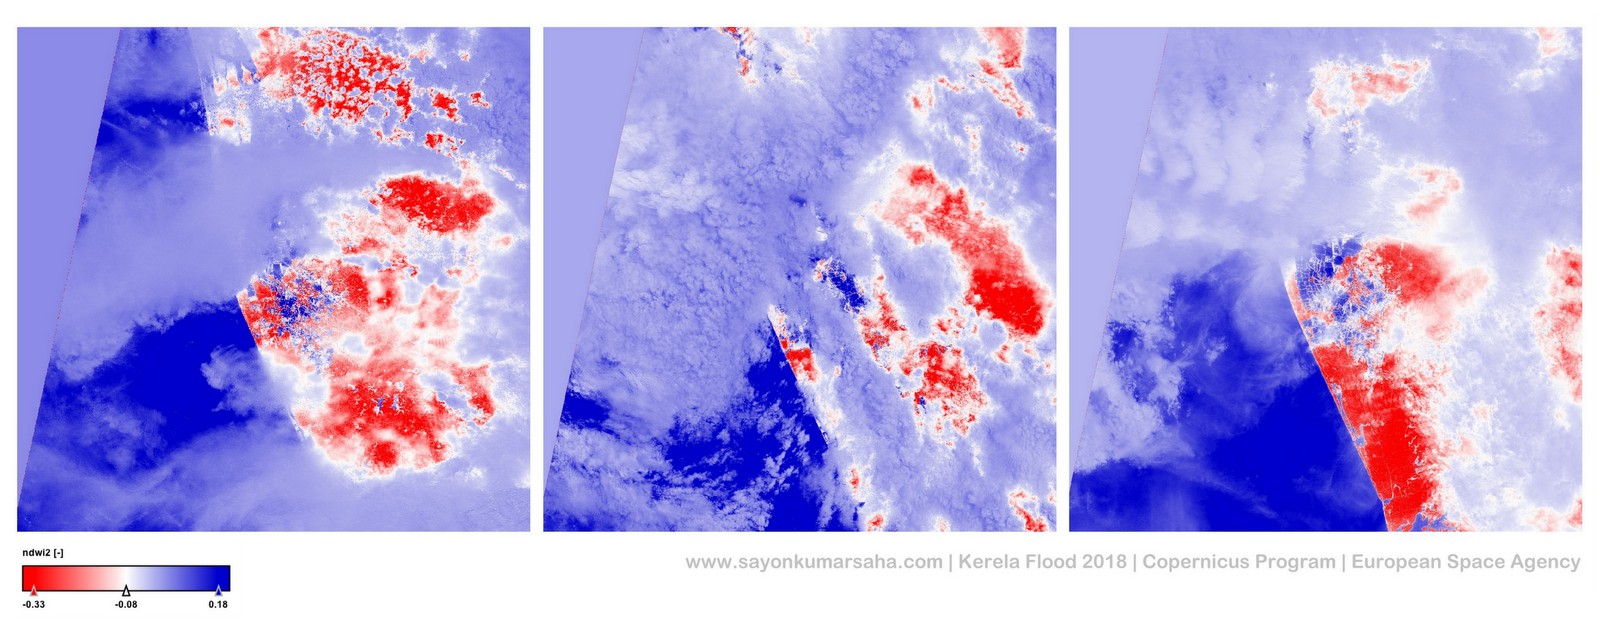
On the other hand, unlike the previous granule, there is distinct change in water level in some parts of the granule. So I decided to zoom into that particular area and the resultant image is as follows:
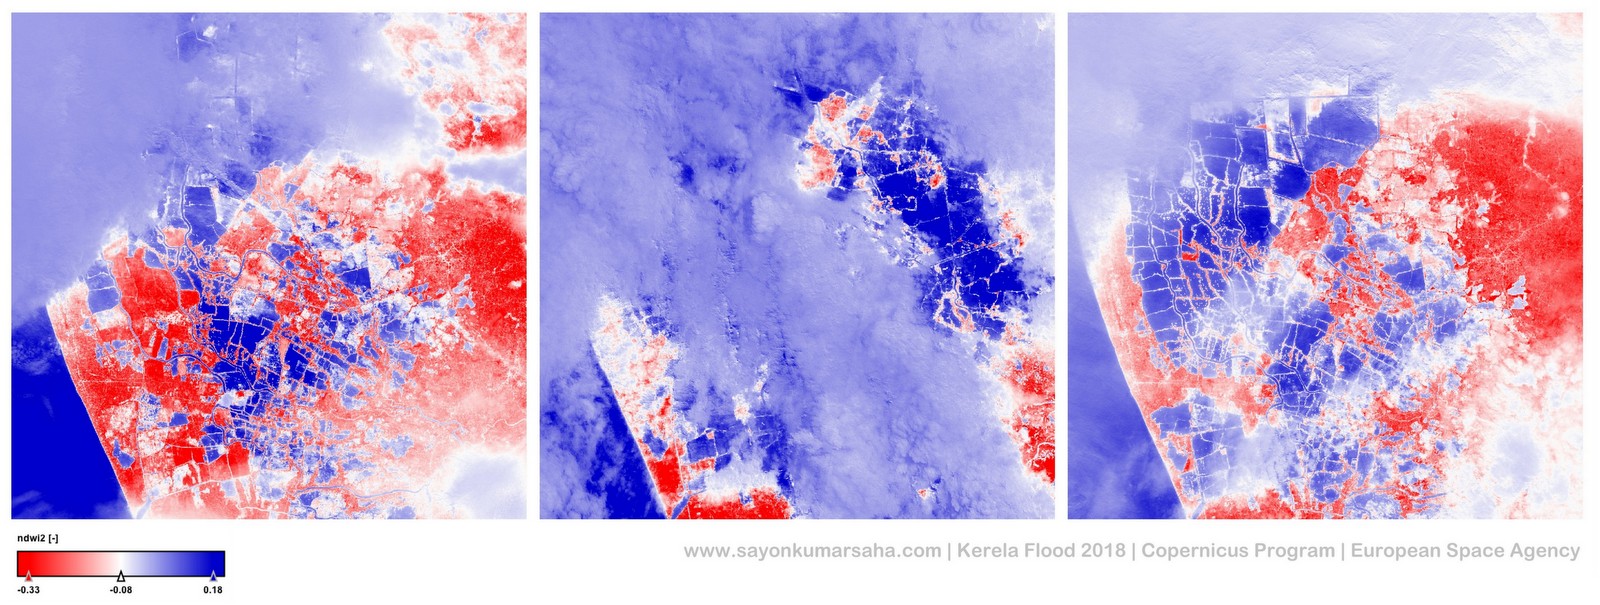
On zooming into this part of the granule which is approximately covering 20 x 20 km on the earth’s surface, it is evident that on 7th August (image on the left) had a lot of high NDWI values (reddish land area) around the low NDWI values (blue lakes). On 17th August (image in middle) when the heavy monsoon rain, the area was covered with clouds and the right hand side had dramatic increase in very low NDWI values (blue lakes). And on 27th August (image on right), while one part had recovered from the dramatic increase in flood, the other part had a lot of increase number of land plots with low NDWI values (blue lakes). This is where actually the dams broke and increases the size of the water bodies.
I have not used the spatial meta-data of this image available in the Sentinel product to embed this in a real map for the scope of this blog.
Applications?
Such insight into water-level over a period of time using satellite data can provide us with accurate spatio-temporal information for monitoring such natural disaster. Automated applications embedding such information in a scalable fashion can help detailed analysis of severity could allow improved disaster management procedures over a period of time with authentic time-series data. Such change detection mechanism with the NSIs mentioned earlier could be also be used for other kind of alerts and monitoring for other emergency situations.
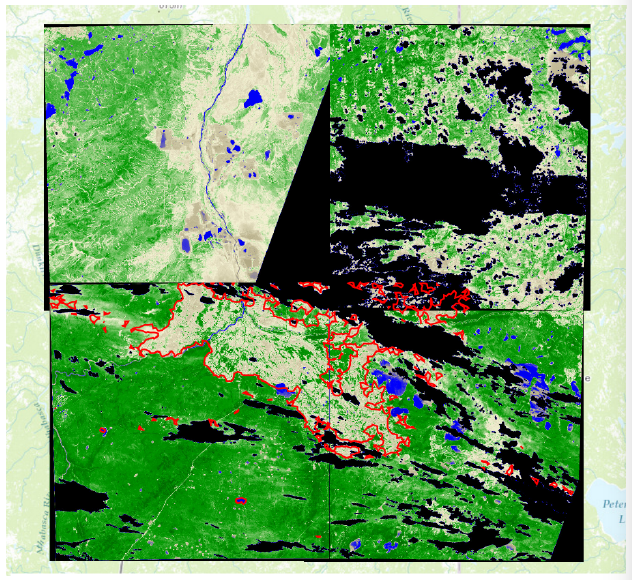
My last application at SAP 2yrs ago with Normalized Difference Vegetation Index (NDVI) on the Fort McMurray Wildfire in Canada in 2016 was useful for insurance companies for validations of claims by the customers detecting invalid customer demands.
I agree that cloud blockage is a major problem with the data generated by Sentinel-2. it could be overcome by either stacking multiple images or using Synthetic Aperture Radar (SAR) data generated by other Sentinel satellites that are cloud free and have different technologies involved to extract useful information.
The other application I worked on was with SAP and DFKI for Segmentation of Satellite Imagery into Land Cover by Domain Adaptation using Deep Learning. I had used pixel-wise Normalized difference Water, Soil and Vegetation Index as features for training neural networks to learn land classification from satellite imagery.
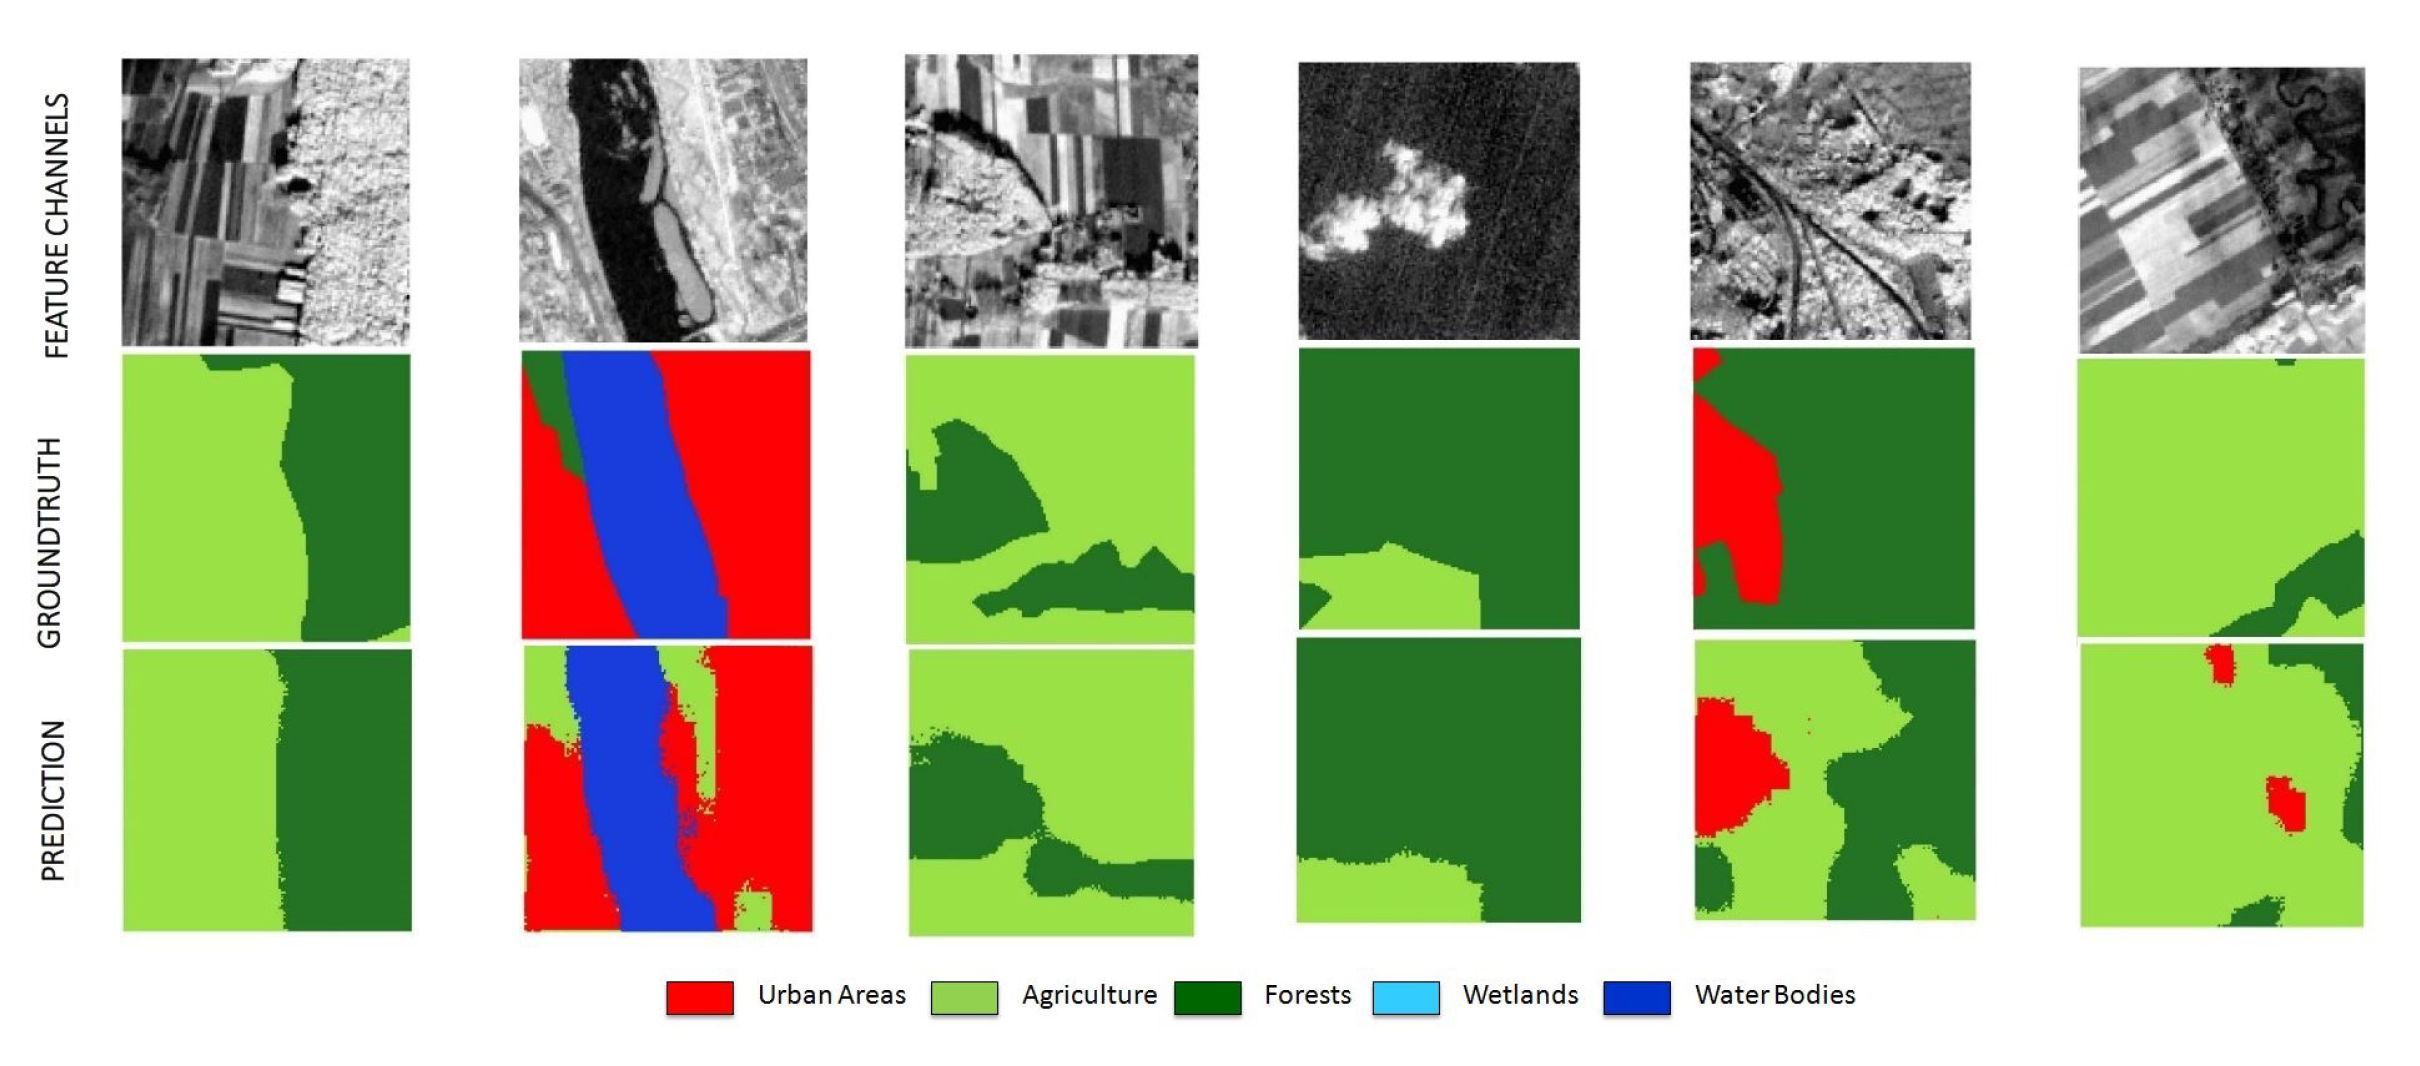
Several machine learning techniques can be further applied on the satellite imageries for tasks such as classification, prediction, anomaly detection, object recognition, etc. The information can range from soil moisture content, vegetation cover, land displacement caused by mining, snow cover, sea-ice thickness, wind direction and speed, land-surface and sea-surface temperatures, water level, sea salinity, chemical substance such as ozone or nitrogen oxide levels, etc.
So go ahead and explore multi-spectral satellite imageries available open-source for your area of interest on the planet earth!
Get in touch?
Feel free to get in touch with any kind of related discussions! 🙂 Drop in honest feedback on comments and stay subscribed here if you are interested! [email-subscribers group=”Public”]


test